PwC · The BMJ · Flourish · Data visualisation
Bespoke Flourish templates, made with the teams that use them
For PwC, The BMJ and Flourish itself, I build bespoke interactive charting templates on the Flourish platform — Sankeys, chords, forest plots, survival curves, timelines. Each is developed in close collaboration with the client's team and tuned to precisely what a report, an article, or a printed page needs.
Templates, not one-offs
Flourish is a visualisation platform: pick a template, pour in your data, publish. The templates that ship with it cover the common cases. This work is the uncommon ones — chart types built for a single client's data and design, so their editors can produce a whole series of visualisations to the same exact spec without going back to a developer each time.
Each template is built on the Flourish platform with the Flourish SDK — a reusable, data-driven chart with its own settings panel — then handed to the client's team to feed with new data, restyle, and embed in a web report or export for print. The build is close, iterative work with the people who commission it, and precise to what a specific project asks for.
PwC — carrying the data stories in flagship reports
For PwC I built interactive templates that hold the central arguments of their thought-leadership reports, styled to house standards and ready for their editors to reuse.
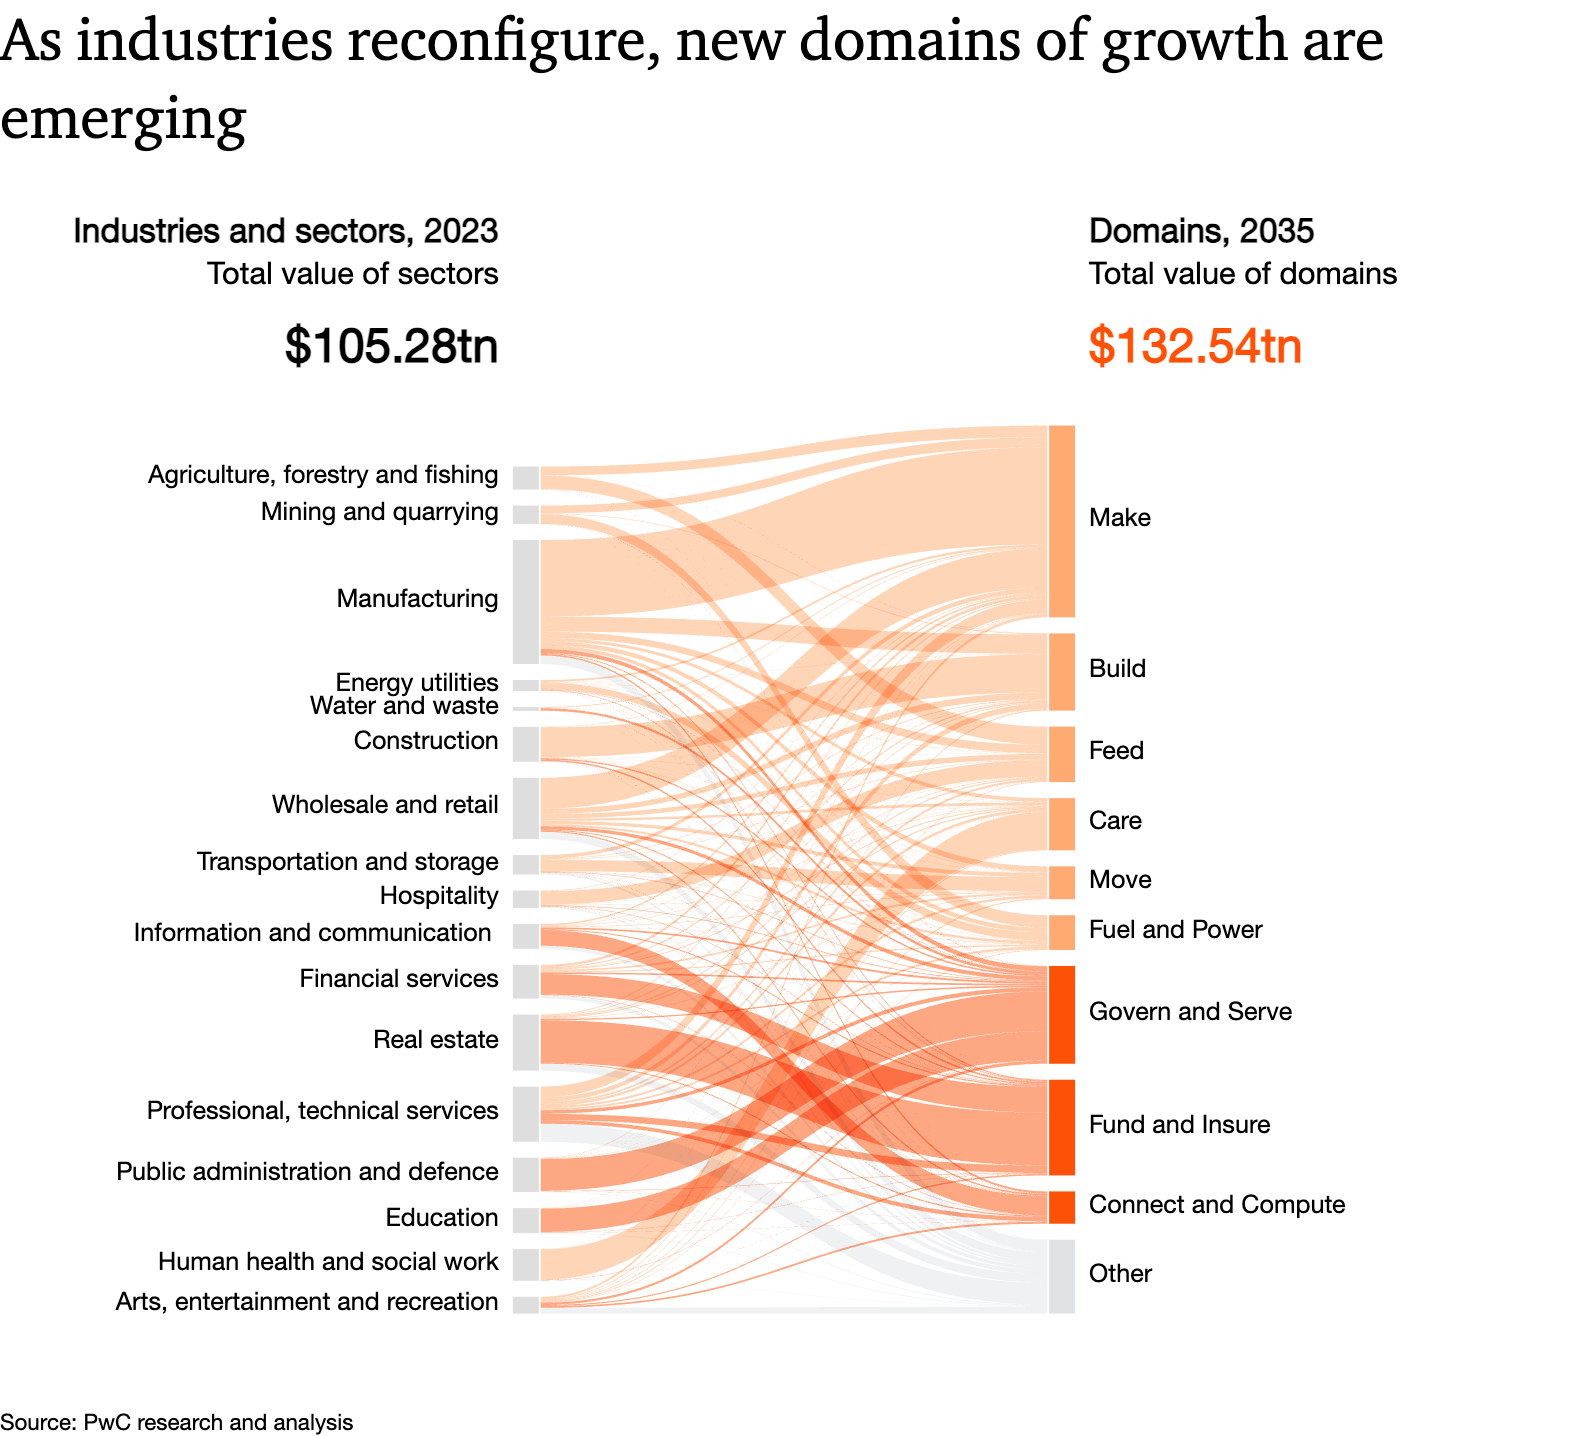
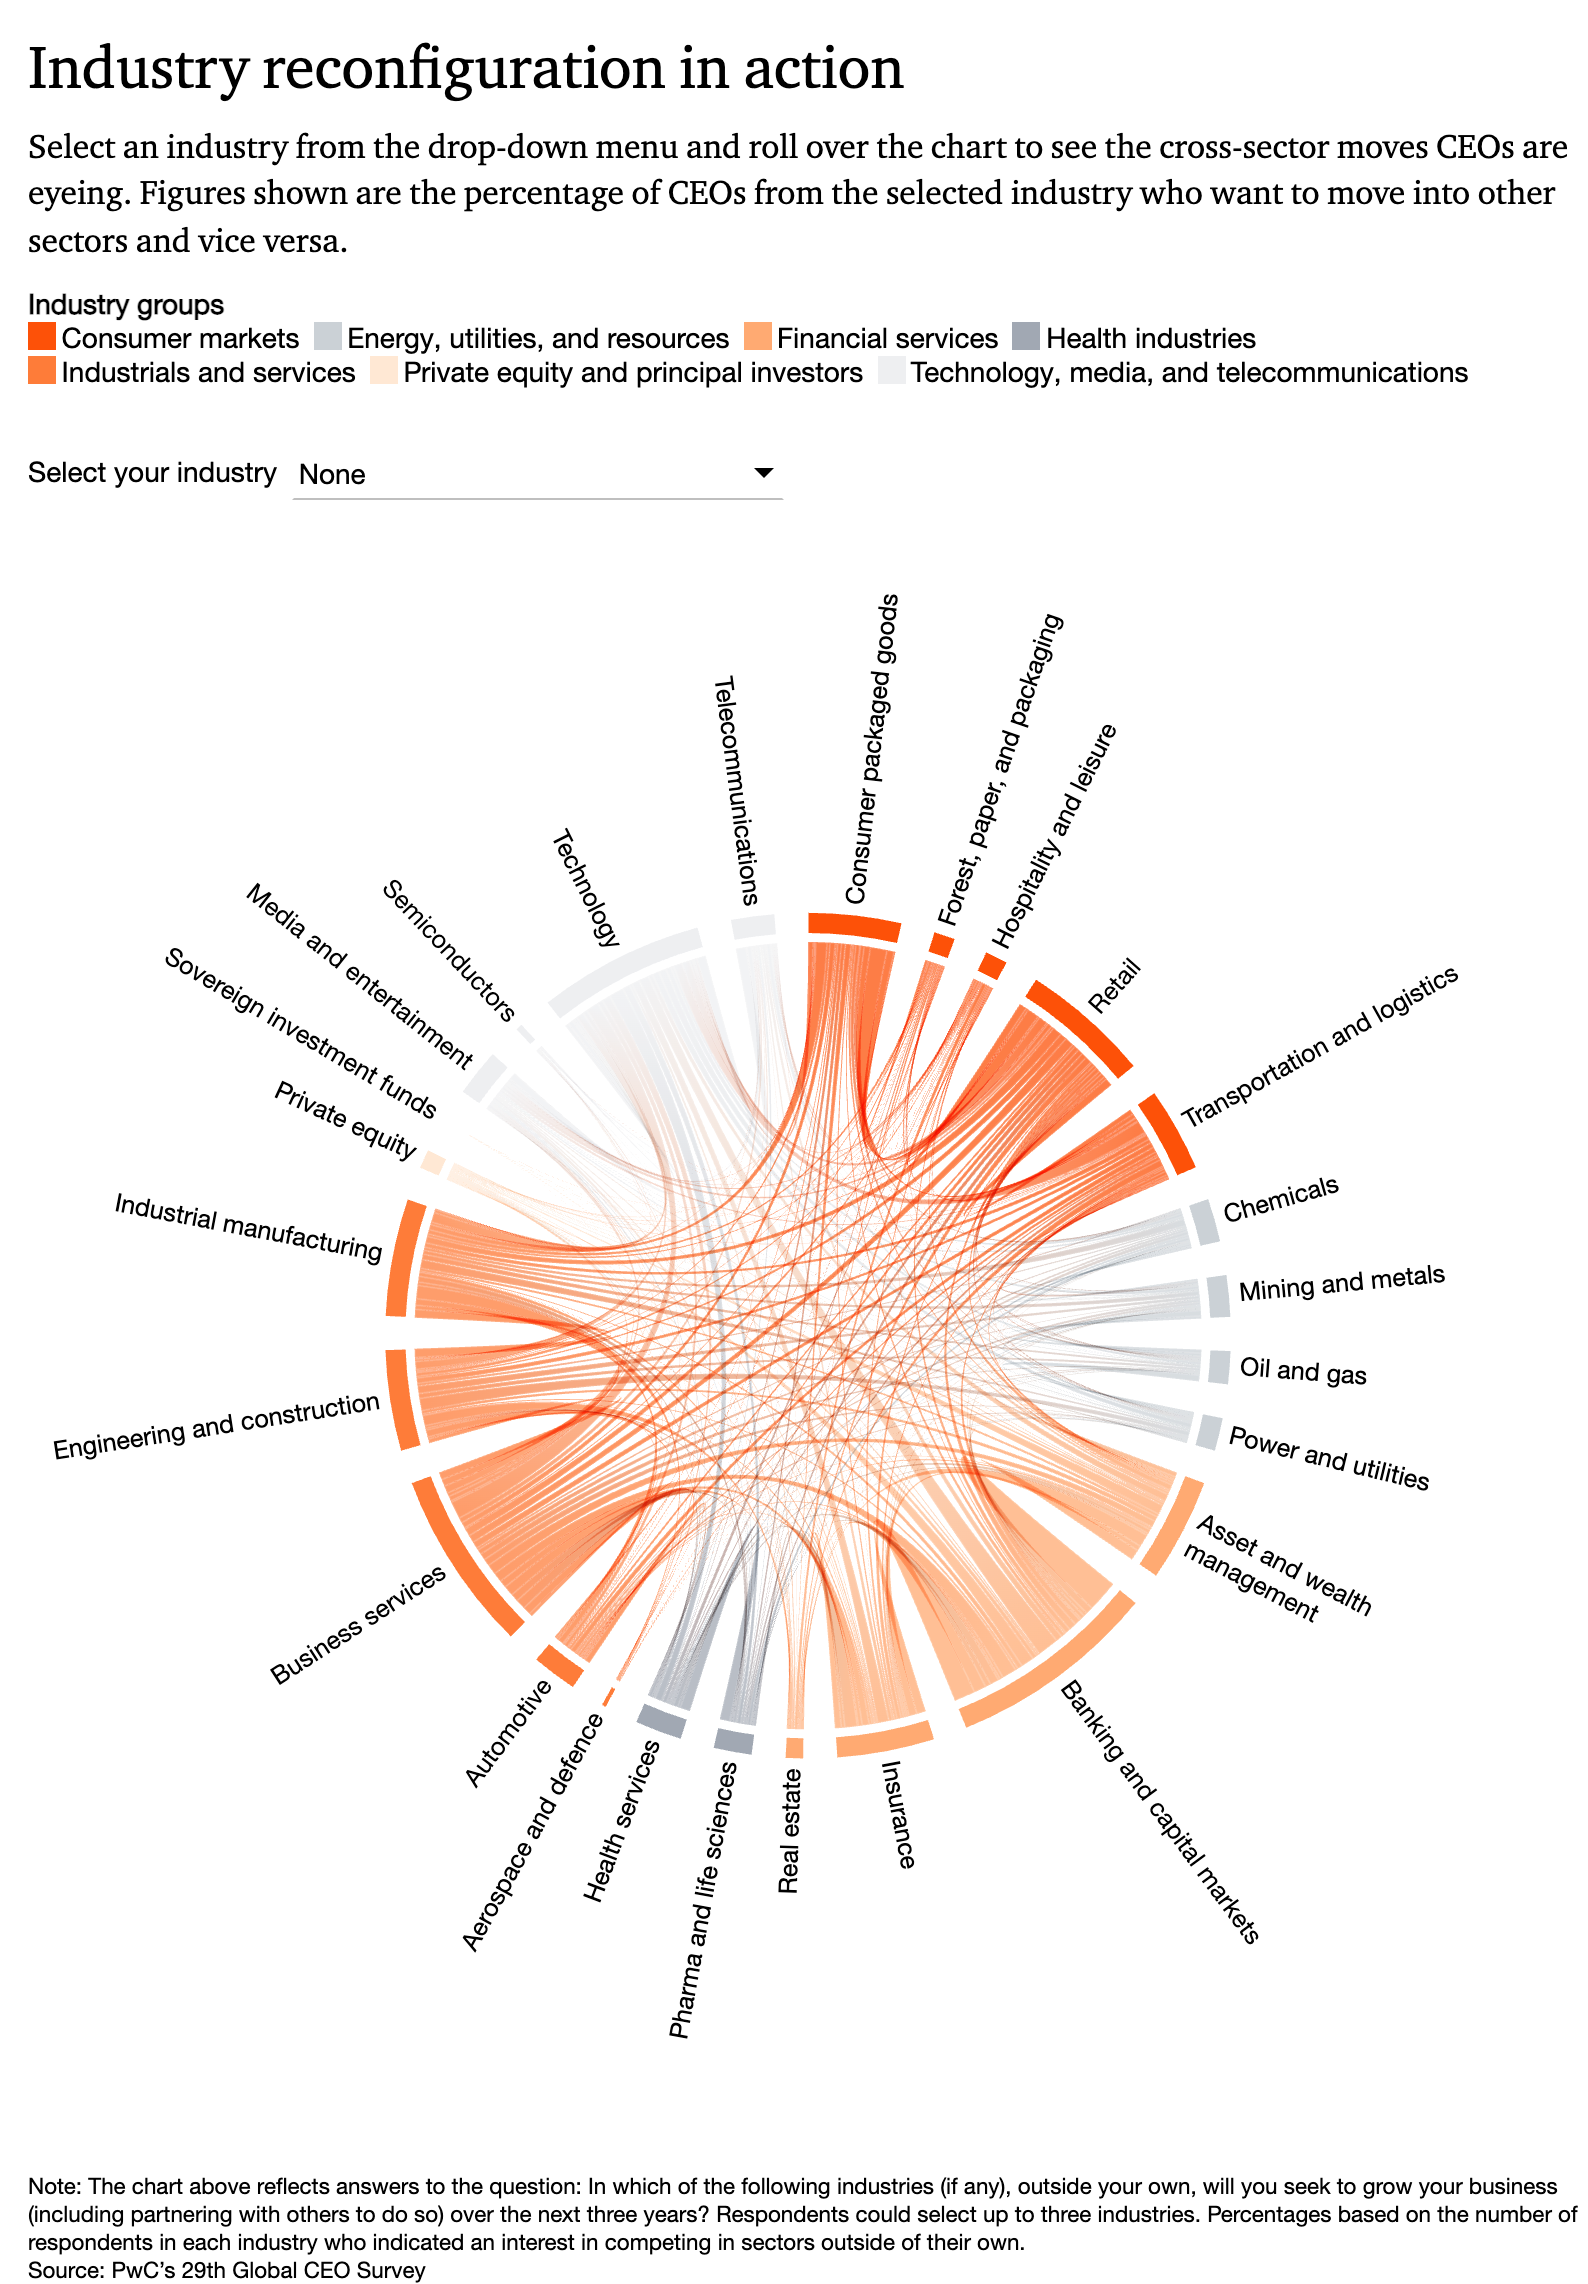
A Sankey mapping the global economy. This one traces how today's industries and sectors flow into tomorrow's domains of growth — roughly $105tn of 2023 sectors reshaped into $132tn of 2035 domains like Make, Build, Feed and Care — with the ribbons sized by value and lit on hover. A chord for the Global CEO Survey. Pick an industry, roll over the ring, and the arcs show the cross-sector moves CEOs are eyeing — who plans to grow into whose territory over the next three years.
PwC — industry convergence → PwC — Global CEO Survey →
The BMJ — statistical charts for peer-reviewed work
For The BMJ the templates had to meet the exacting conventions of medical publishing — the kind of figures that appear in peer-reviewed articles and carry a DOI, where a misread axis is a real problem.
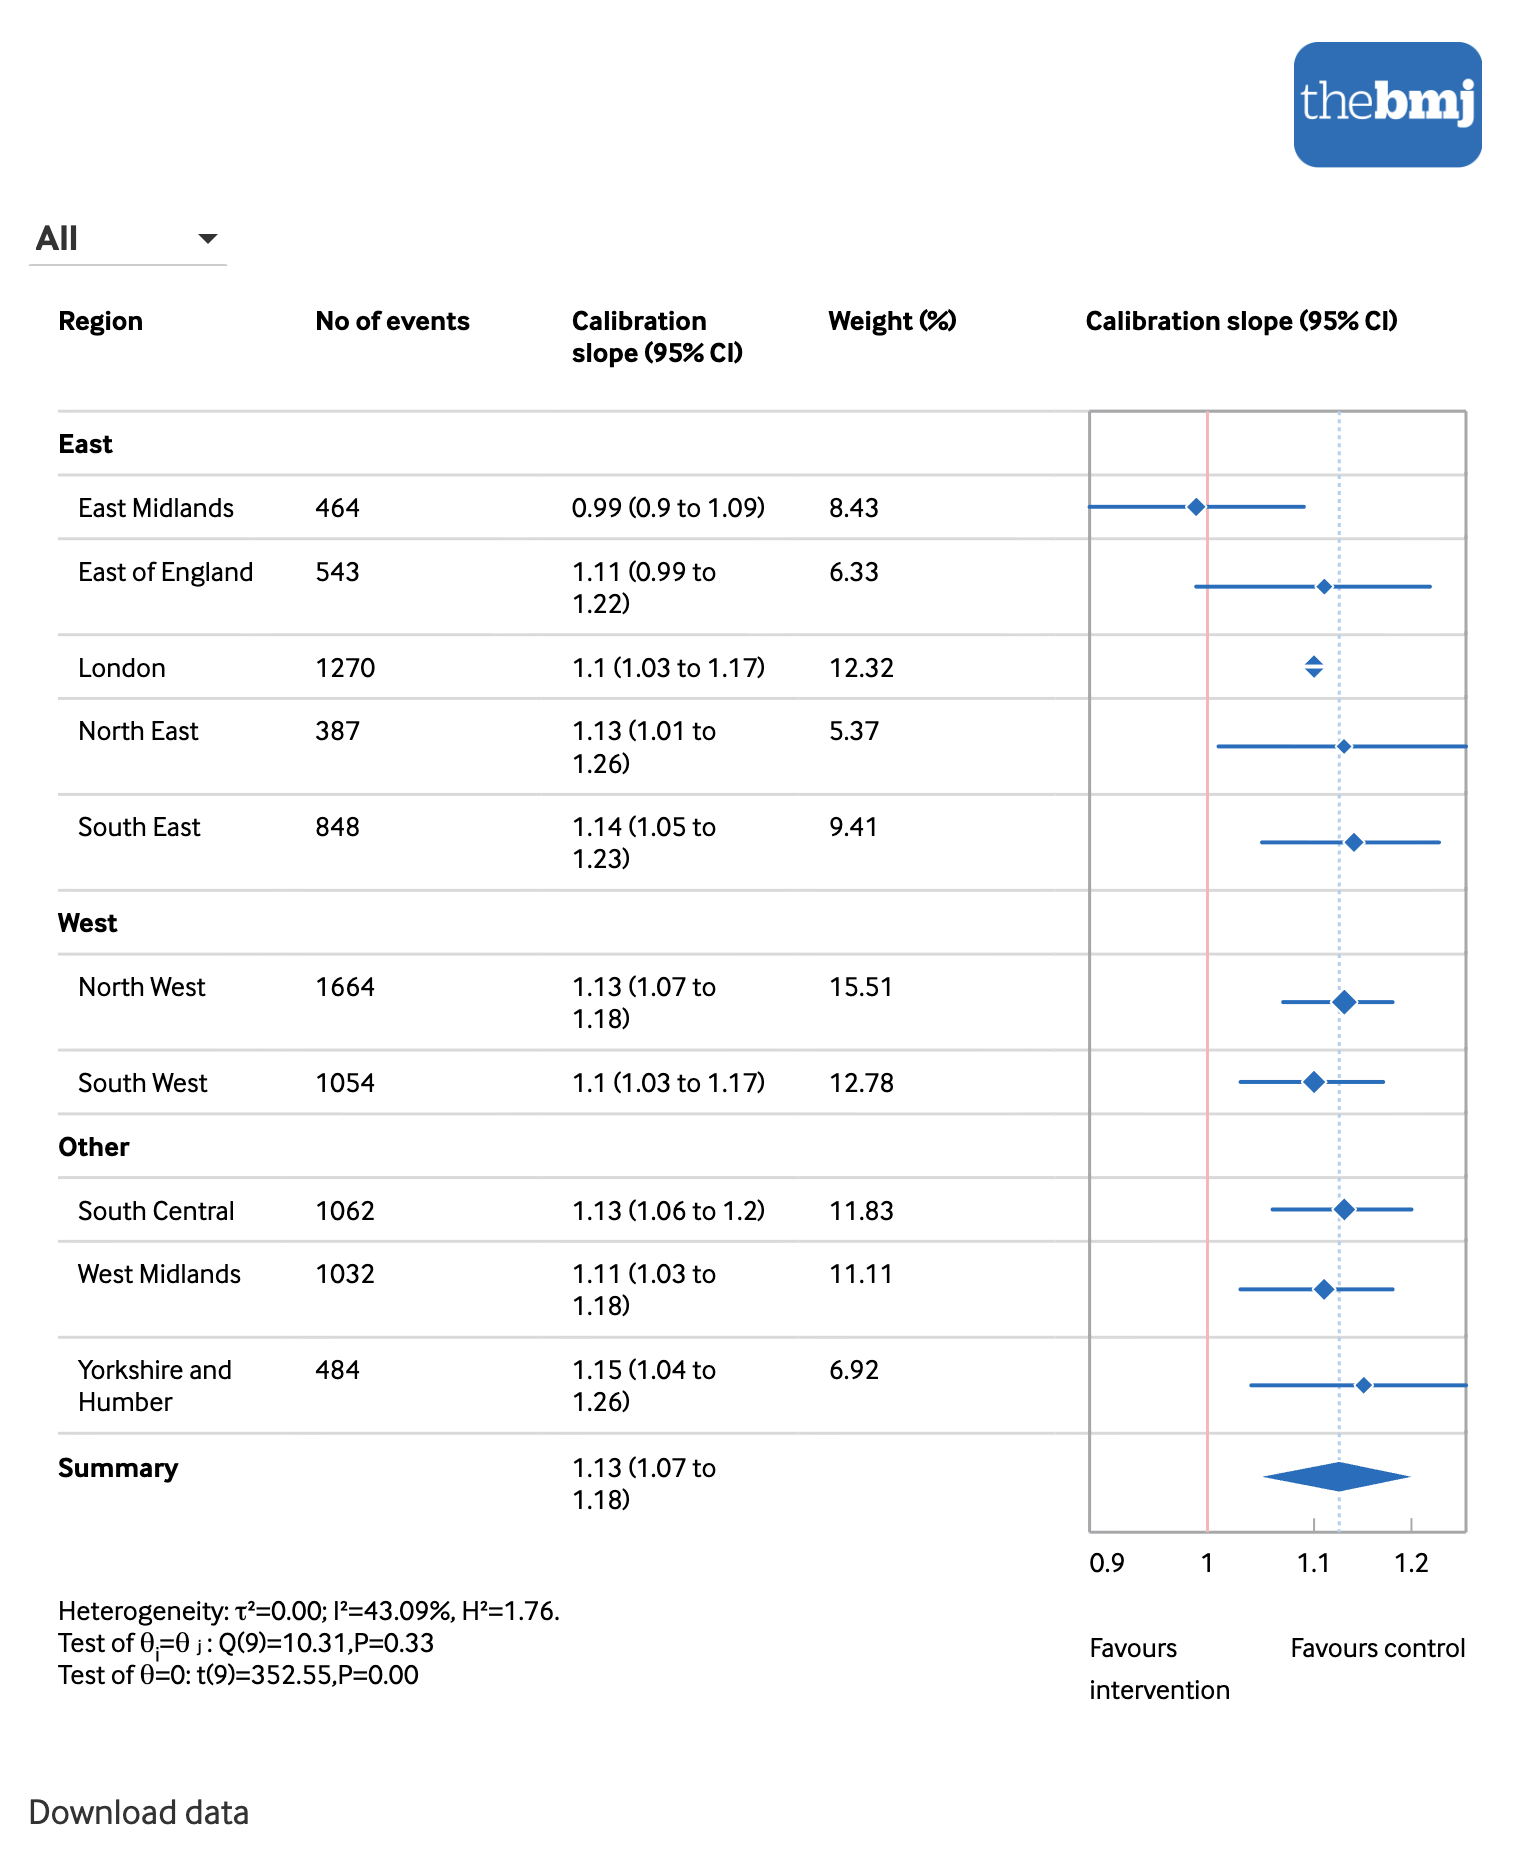
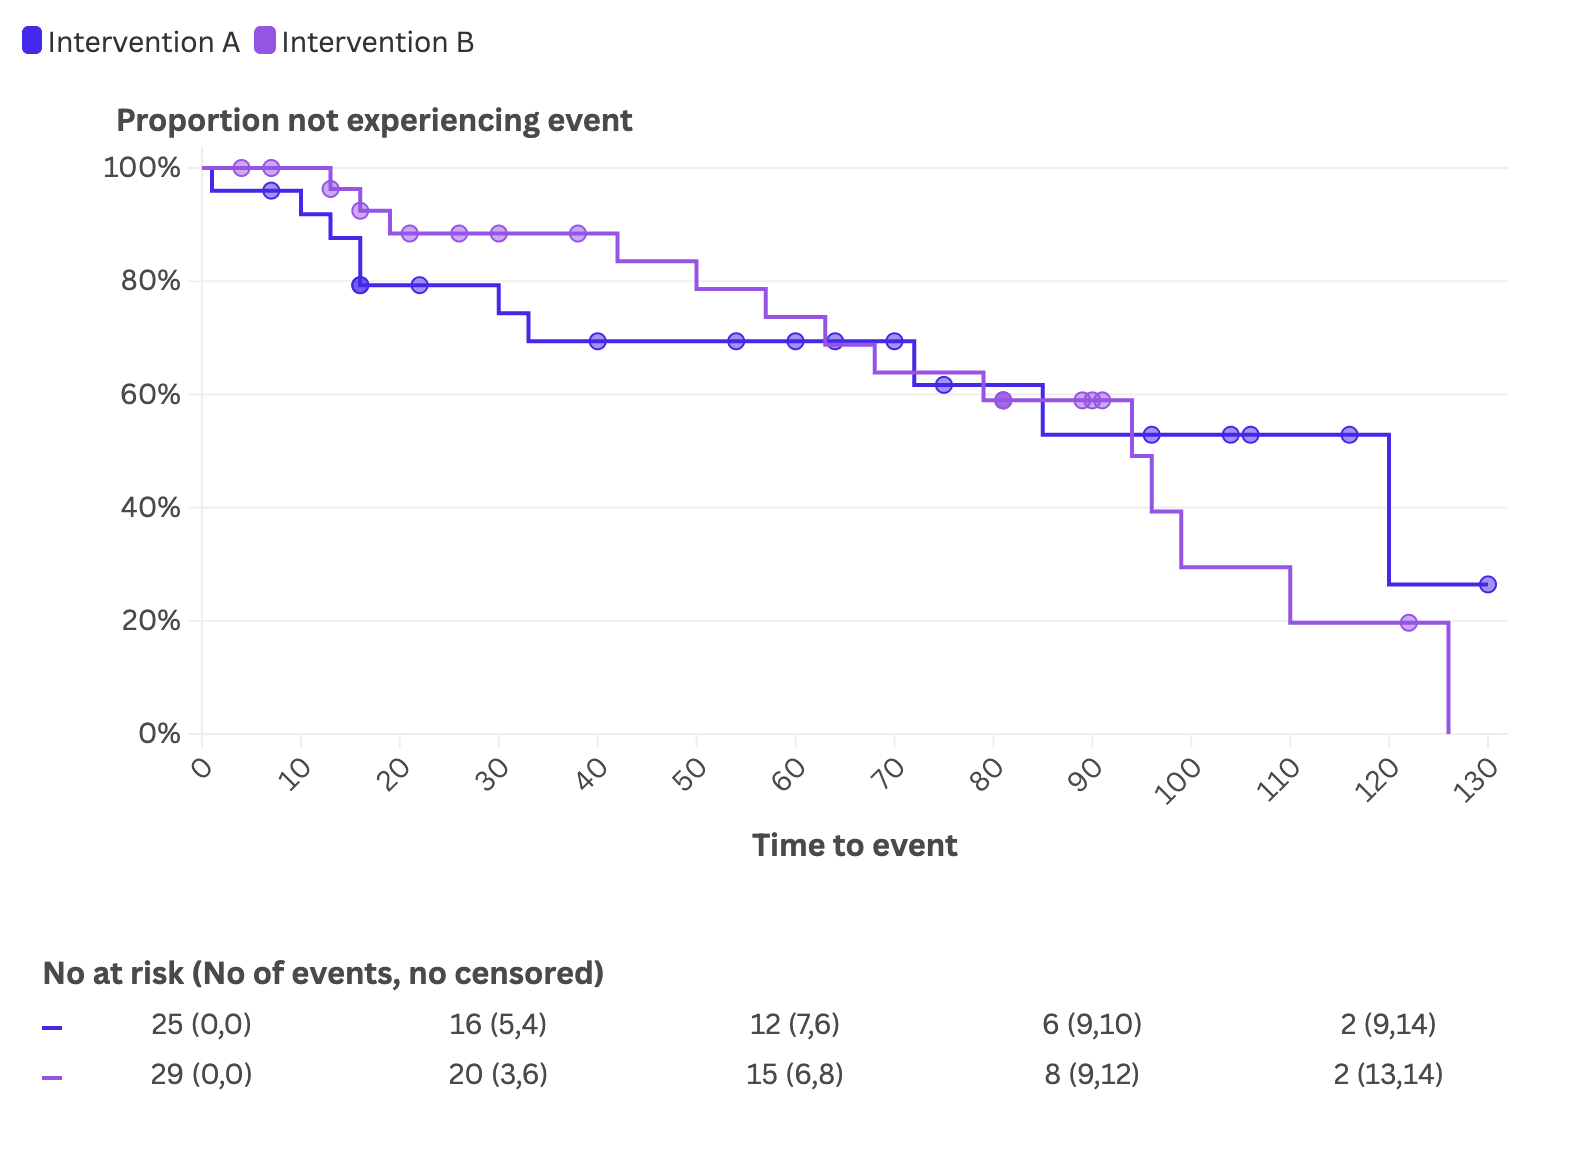
A meta-analysis forest plot. Per-region calibration slopes with 95% confidence intervals, weights, a pooled summary diamond and heterogeneity statistics — filterable by group, with the underlying data downloadable. A Kaplan–Meier survival curve. Two intervention arms stepping down over time, with censoring marks along each curve and a numbers-at-risk table beneath — the standard way clinical outcomes are read.
Flourish — the Timeline template
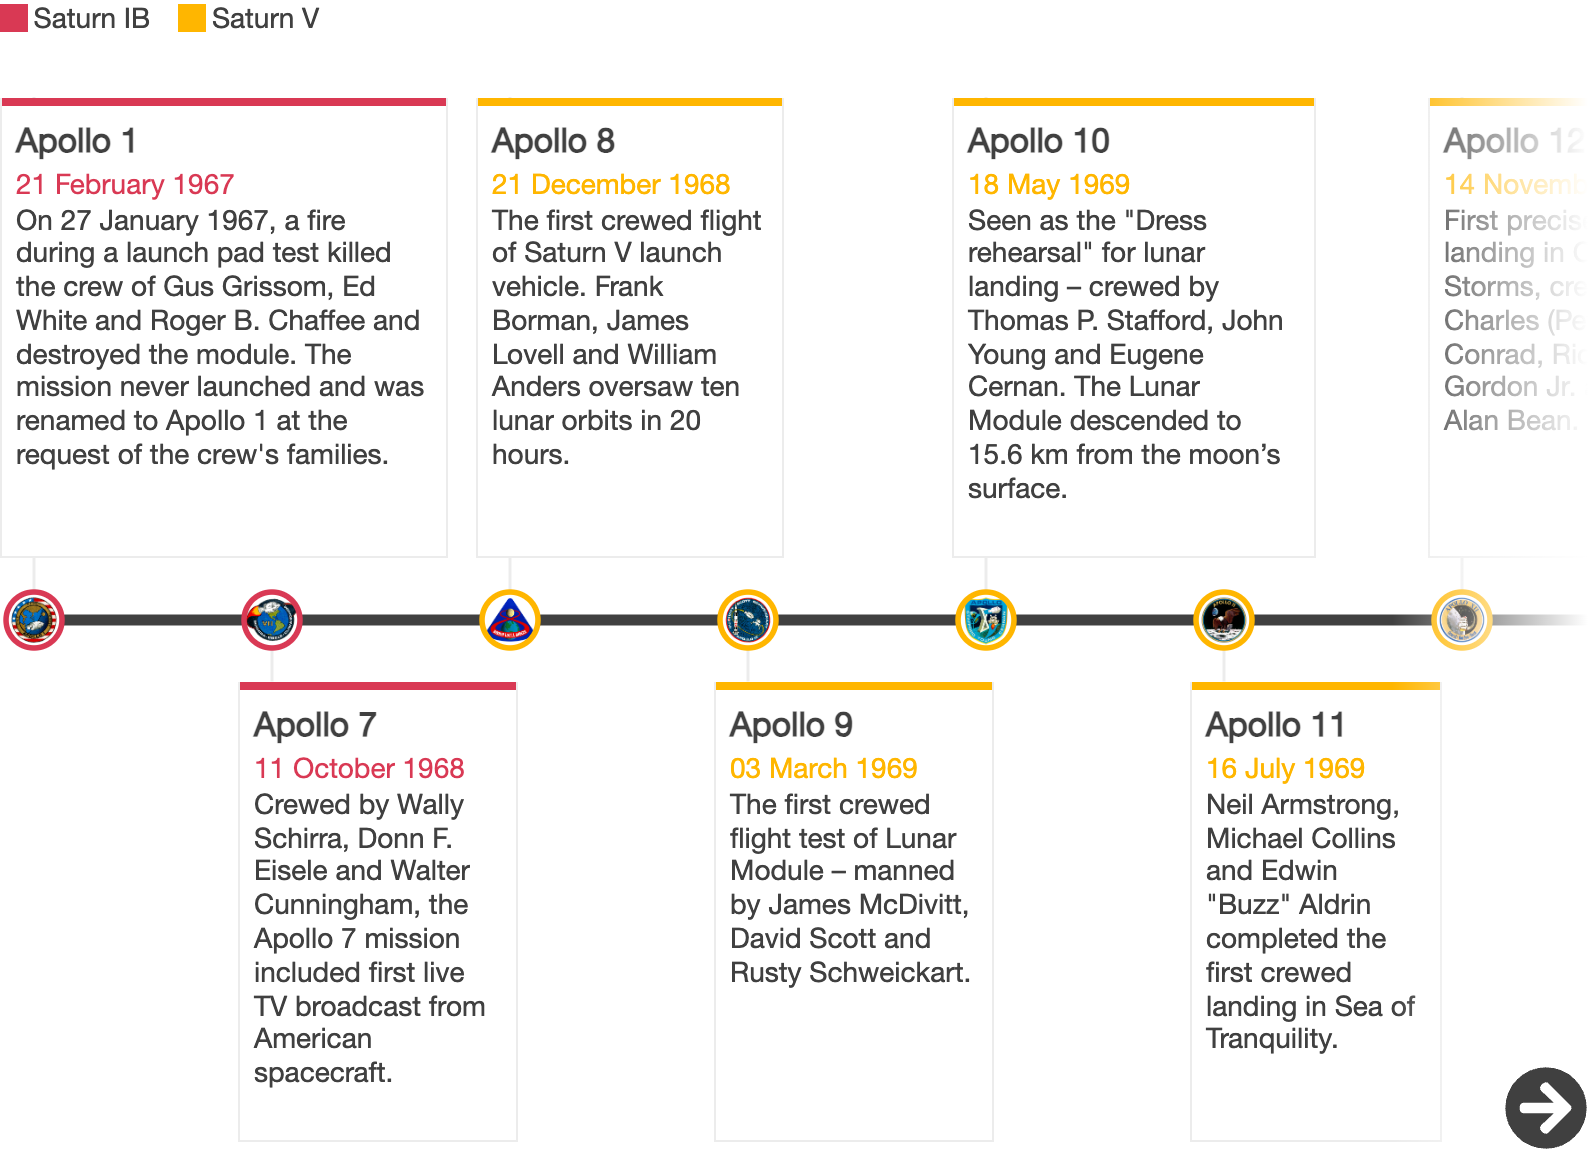
For Flourish themselves, I built the Timeline template that now sits in their public library, where it's published and maintained by the Flourish team for everyone on the platform to use. It lays a series of events along a horizontal or vertical axis — colour-coded by category, with custom markers, images and navigation — spaced either evenly or on a true time scale.
One craft, several houses
Each of these began the same way — a client team that knew exactly what their data needed to say, and a chart type that didn't yet exist quite the way they needed it. The template is where that gets settled once, so it can be reused many times. It's close, ongoing collaboration, shaped each time to a different house's data, brand and medium.