Gauge · Systems & data visualisation
Data visualisations and the software systems beneath them
For Gauge, a user-centric research consultancy out of the San Francisco Bay Area, I built two open-source products — anchorbox and sandbox — end to end, from the back-end architecture up to the data-visualisation displays researchers actually read. Both were made to put rigorous research within reach of teams everywhere.
Two tools, one job
Gauge is a consultancy of ethnographers, designers, data scientists and engineers who help product and marketing leads find clear causality in the wisdom of crowds. anchorbox and sandbox take two slices of that practice — survey segmentation and reading unstructured text — and hand them to any research team as open-source tools. I built both the software systems that carry them and the data-visualisation displays researchers read them through.
anchorbox — surveys, turned into segments
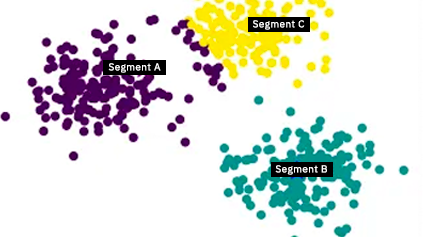
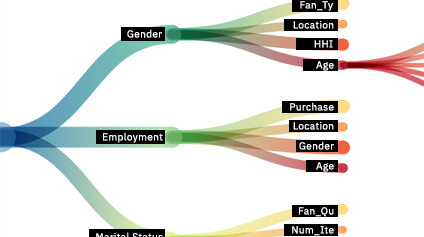
anchorbox lets the research community experiment with survey- and product-based segmentation. Rather than sorting respondents by instinct, an evidence-based approach surfaces the factors that make each segment distinct — so teams can shape personas, conversation guides and moderation scripts on what the data actually shows.
sandbox — reading text at a scale the eye can't
sandbox lets researchers see and compare their own unstructured datasets through three open-source visualization displays. By abstracting large amounts of text into visual patterns, it surfaces trends at a scale that isn't normally perceptible:
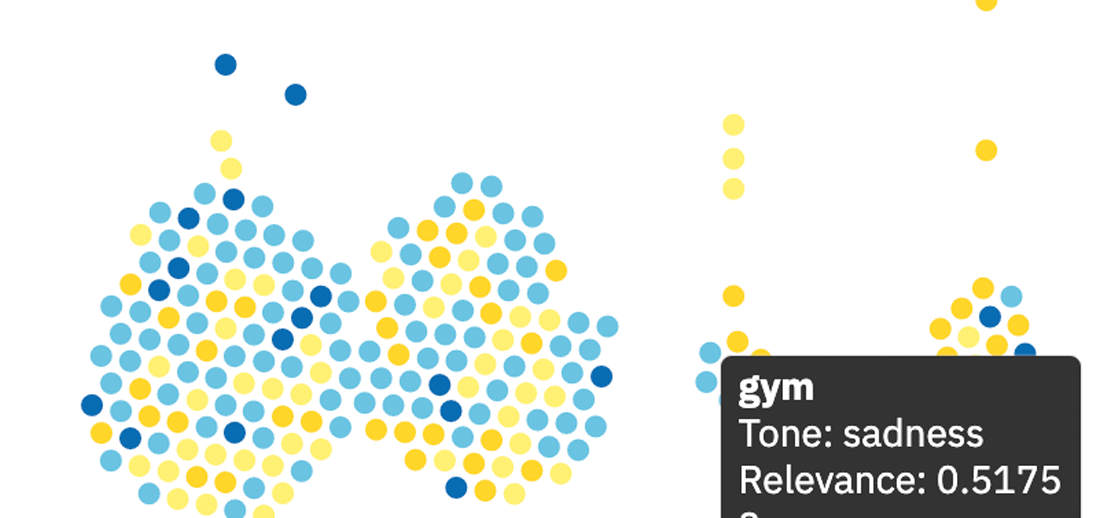
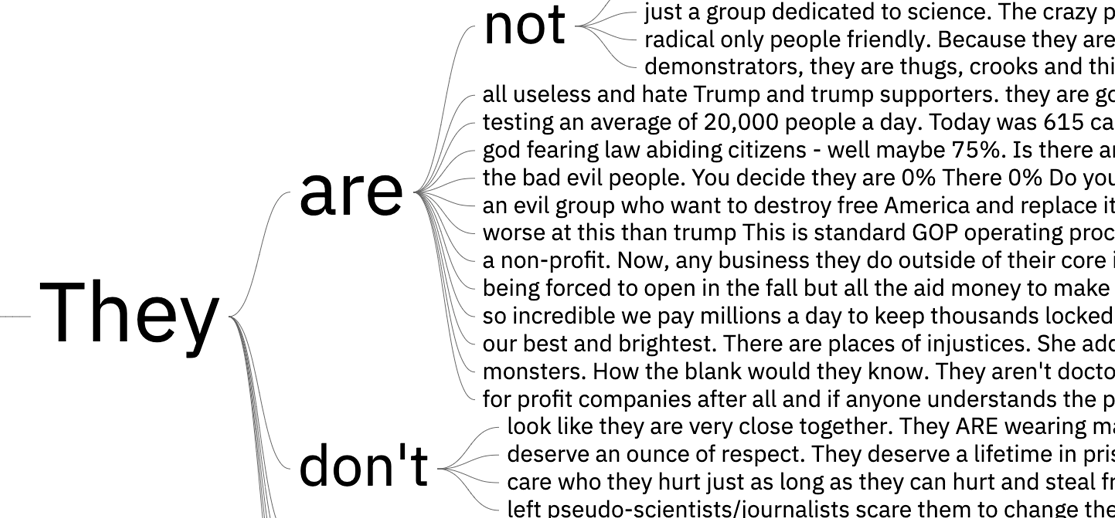
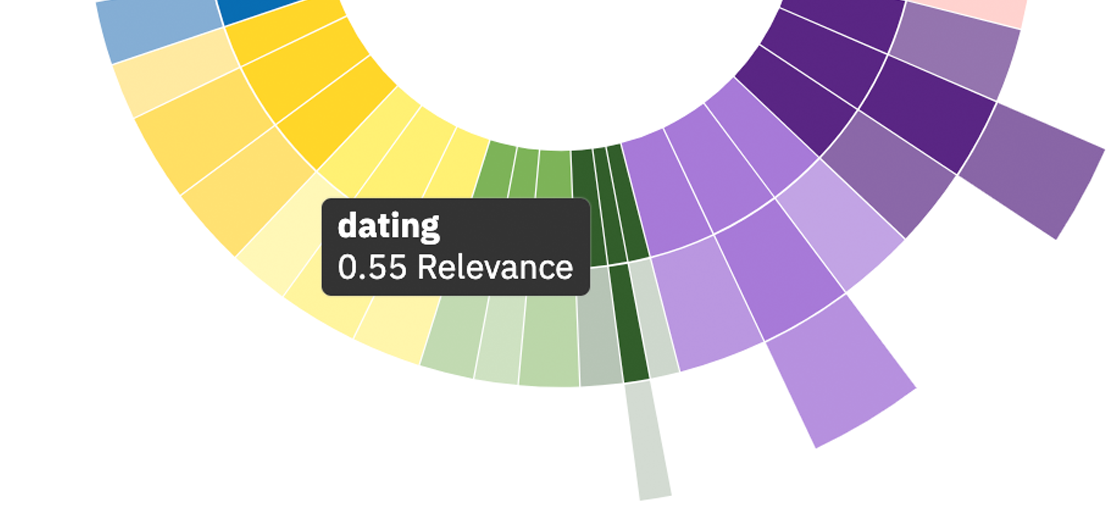
ScatterText plots how language differs between two groups. WordTree shows both the hierarchy and the context of a keyword — read left to right and you see which words tend to follow one another, sized by how common they are. SunBurst is a radial view of the topics inside a dataset, each segment's width standing for how many rows fall under it.
The systems — and the displays on top
The work ran the full depth of each tool. Underneath sit the architecture and back-end services that ingest a dataset, run the analysis, and feed the front ends — built on Node with an event-driven, service-oriented shape, so each tool stays responsive as datasets grow. On top sit the data visualisations themselves: anchorbox's segment scatter and factor trees, and sandbox's three D3 displays — ScatterText, WordTree and SunBurst — which I implemented against those same services. Both shipped open source, so the same rigour is available to teams who could never commission it from scratch.
An ongoing collaboration
anchorbox and sandbox are two of many projects I've worked on with Gauge. The collaboration has run across a range of research tools and systems, and continues today.